How to construct a perturbed kNN graph?
by Yasser El-Manzalawy yasser@idsrlab.com
In this tutorial, we show how to construct directed/undirected perturbed kNN graphs [1]. This algorithm simply uses bootstrapping to perturb the graph (i.e., obtain several boostrapped graphs and aggregate them). An important property of the resulting perturbed kNN graphs is that it may not have the same k for every vertex.
References: [1] Wagaman, A. (2013). Efficient k‐NN graph construction for graphs on variables. Statistical Analysis and Data Mining: The ASA Data Science Journal, 6(5), 443-455.
In [1]:
import numpy as np
import pandas as pd
import networkx as nx

from proxi.algorithms.pknng import get_pknn_graph
from proxi.utils.misc import save_graph, save_weighted_graph
from proxi.utils.process import *
from proxi.utils.distance import abs_correlation

import warnings
warnings.filterwarnings("ignore")
Variables and Parameters settings
In [2]:
# Input OTU Table
healthy_file = './data/L6_healthy_train.txt'

# Output file(s)
healthy_graph_file = './graphs/L6_healthy_train_pknng.graphml'   # Output file for pkNN graph
# Output file for weighted and directed pkNN graph
healthy_weighted_directed_graph_file = './graphs/L6_healthy_train_weighted_directed_pknng.graphml'

# Parameters
num_neighbors = 5        # Number of neighbors, k, for kNN graphs
dist = abs_correlation   # distance function
T=100                    # No of iterations
c=0.6                    # control parameter for pknng algorithm
Load OTU Table and remove useless OTUs
In [3]:
# load OTU Table
df = pd.read_csv(healthy_file, sep='\t')

# proprocess OTU Table by deleting OTUs with less than 5% non-zero values
df = select_top_OTUs(df, get_non_zero_percentage, 0.05, 'OTU_ID')
IDs = df['OTU_ID'].values
Construct an undirected pkNN graph
In [4]:
# construct kNN-graph
nodes, a,_ = get_pknn_graph(df, k=num_neighbors, metric=dist, T=T, c=c)

# save the constructed graph in an edge list format
save_graph(a, nodes, healthy_graph_file)
Shape of original data is (161, 200)
Now, you can use Cytocscape to visualize (and analyze) the constructed
graph (See Fig. 1). 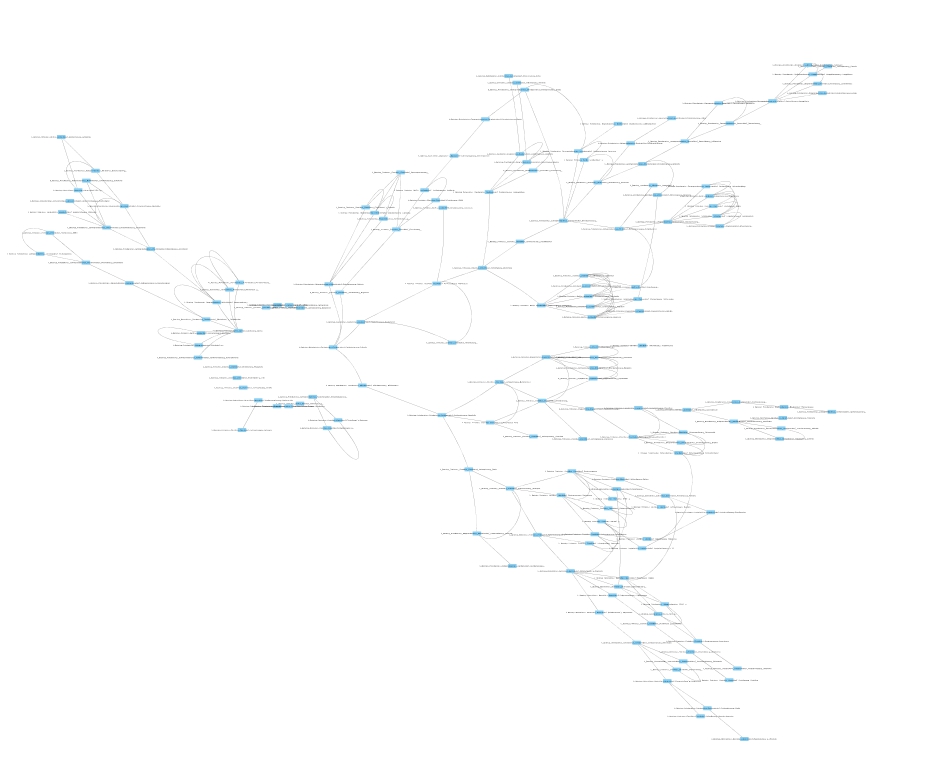 Figure 1: Perturbed kNN undirected
proximity graph constructed from healthy OTU table using k=5, T=100, and
c=0.6.
Figure 1: Perturbed kNN undirected
proximity graph constructed from healthy OTU table using k=5, T=100, and
c=0.6.
Construct a weighted and directed pkNN graph
In [5]:
# construct directed kNN-graph
nodes, a, weights = get_pknn_graph(df, k=num_neighbors,  metric=dist, T=T, c=c, is_undirected=False, is_weighted=True)

# save the constructed graph in an edge list format
save_weighted_graph(a, nodes, weights, healthy_weighted_directed_graph_file)
Shape of original data is (161, 200)
Now, use Cytoscape to visualize the graph (See Fig. 2). 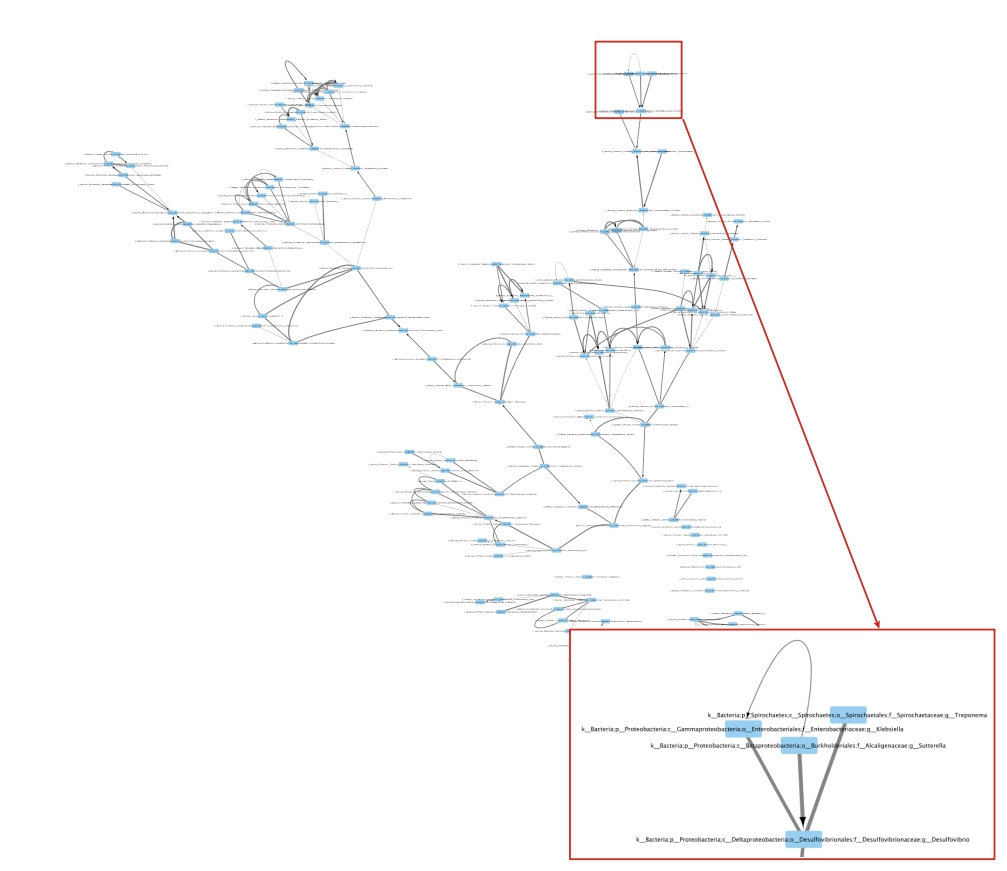 Figure
2: Perturbed kNN weighted and directed proximity graph constructed from
healthy OTU table using k=5, T=100, and c=0.6.
Figure
2: Perturbed kNN weighted and directed proximity graph constructed from
healthy OTU table using k=5, T=100, and c=0.6.