How to construct a proximity kNN graph?
by Yasser El-Manzalawy yasser@idsrlab.com
In this tutorial, we show how to construct undirected and directed kNN graphs from an Operational Taxonomic Unit (OUT) table.
An OTU Table is a form of the results that you will get from a metagenomics taxonomy classification pipeline. In that table, we are giving (for each sample) the number of sequences in each OTU and the taxonomy of that OTU. Samples correspond to columns and OTUs correspond to rows. OTUs taxonomy is the first column (by default) but it could be any column.
In [1]:
import numpy as np
import pandas as pd
import networkx as nx

from proxi.algorithms.knng import get_knn_graph
from proxi.utils.misc import save_graph, save_weighted_graph
from proxi.utils.process import *
from proxi.utils.distance import abs_correlation

import warnings
warnings.filterwarnings("ignore")
Variables and Parameters settings
In [2]:
# Input OTU Table
healthy_file = './data/L6_healthy_train.txt'

# Output file(s)
healthy_graph_file = './graphs/L6_healthy_train.graphml'
healthy_directed_graph_file = './graphs/L6_healthy_train_directed.graphml'


# Parameters
num_neighbors = 5       # number of nearest neighbors in the kNN graph
dist = abs_correlation  # distance function
Load OTU Table and remove useless OTUs
In [3]:
# Load OTU Table
df = pd.read_csv(healthy_file, sep='\t')

# Delete OTUs with less than 5% non-zero values
df = select_top_OTUs(df, get_non_zero_percentage, 0.05, 'OTU_ID')
Construct an undirected kNN graph
In [4]:
# Construct kNN-graph
nodes, a = get_knn_graph(df, k=num_neighbors,  metric=dist)

# Save the constructed graph in an edge list format
save_graph(a.todense(), nodes, healthy_graph_file)
Like other graph inference tools, proxi doesn’t support any network
visualization functionality. Here, we used Cytoscape to open our graphml
file and change the network layout to ‘Radial layout’ (see Figure 1).
Moreover, Cytoscape has many tools and plugins that could be used for
downstream analyses of our constructed networks. ! 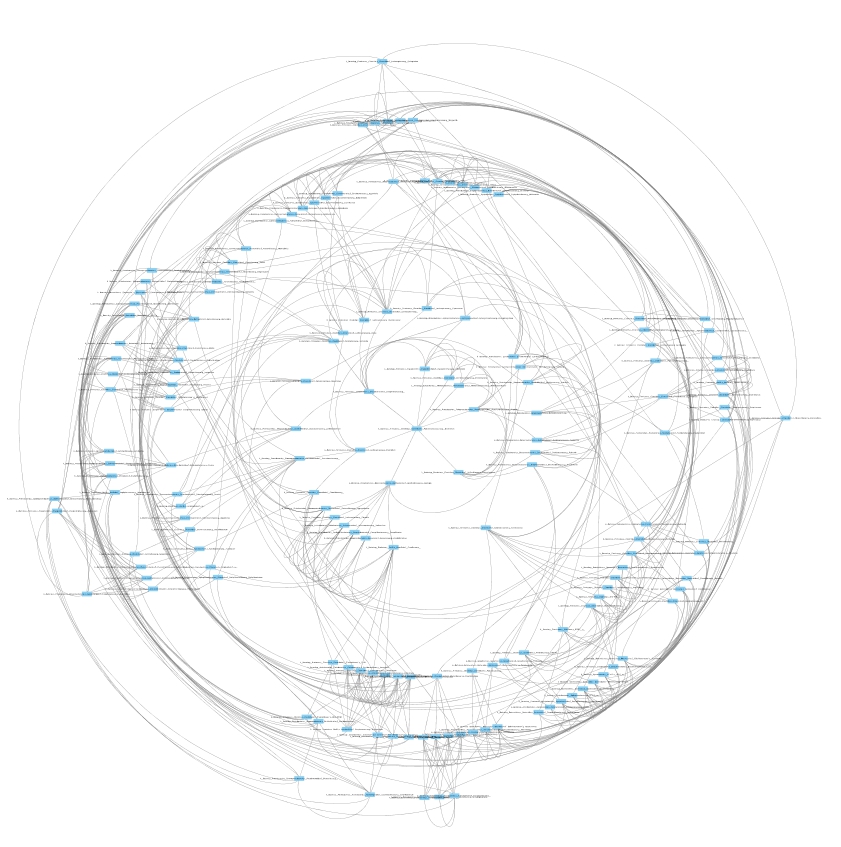 Figure 1:
kNN undirected proximity graph constructed from healthy OTU table using
k = 5.
Figure 1:
kNN undirected proximity graph constructed from healthy OTU table using
k = 5.
Construct a directed kNN graph
In [5]:
# construct directed kNN-graph
nodes, a = get_knn_graph(df, k=num_neighbors,  metric=dist, is_undirected=False)

# save the constructed graph in an edge list format
save_graph(a.todense(), nodes, healthy_directed_graph_file, create_using=nx.DiGraph())
Now, let’s visualize the constructed directed network using Cytoscape.
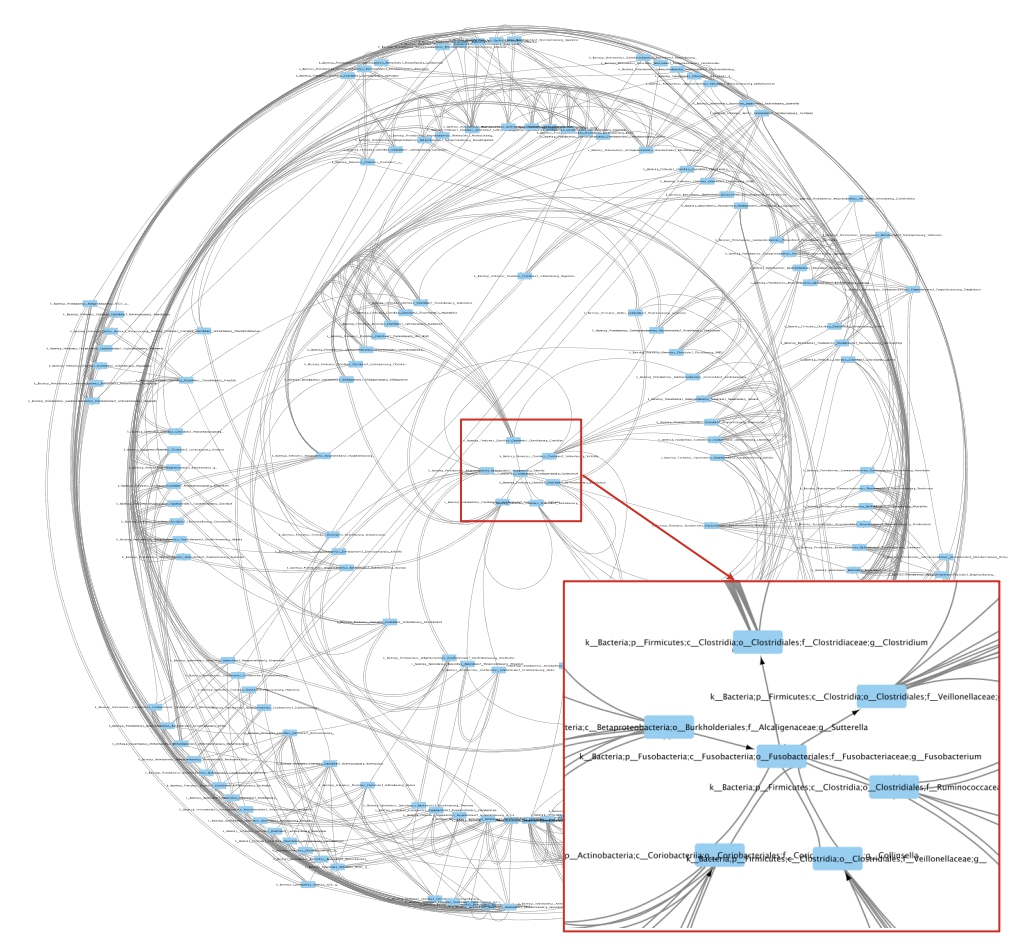 Figure 2: kNN directed proximity graph constructed from healthy
OTU table using k = 5.
Figure 2: kNN directed proximity graph constructed from healthy
OTU table using k = 5.
Limitation of kNN graphs
A major limitation of the constructed kNN graphs in Figures 1 and 2 is that the constructed graphs might not be sparse. This limitation could be addressed using different approaches including:
<li> Using smaller k. </li>
<li> Using Perturbed kNN Graphs (see Tutorial 2). </li>
<li> Using aggregated graphs constructed using different distance functions (see Tutorial 3).</li>